Creating a Monitor
To create a monitor, you need to complete these steps:Send Traces
Connect the SDK to your system and add decorators to your flow. See OpenLLMetry for setup instructions.
Choose an Evaluator
Select the evaluation logic that will run on matching spans. You can define your own custom evaluators or use the pre-built ones by Traceloop. See Evaluators for more details.
Basic Monitor Setup
Navigate to the Monitors page and click the New button to open the Evaluator Library. Choose the evaluator you want to run in your monitor. Next, you will be able to configure which spans will be monitored.Span Filtering
The span filtering modal shows the actual spans from your system, letting you see how your chosen filters apply to real data. Add filters by clicking on the + button.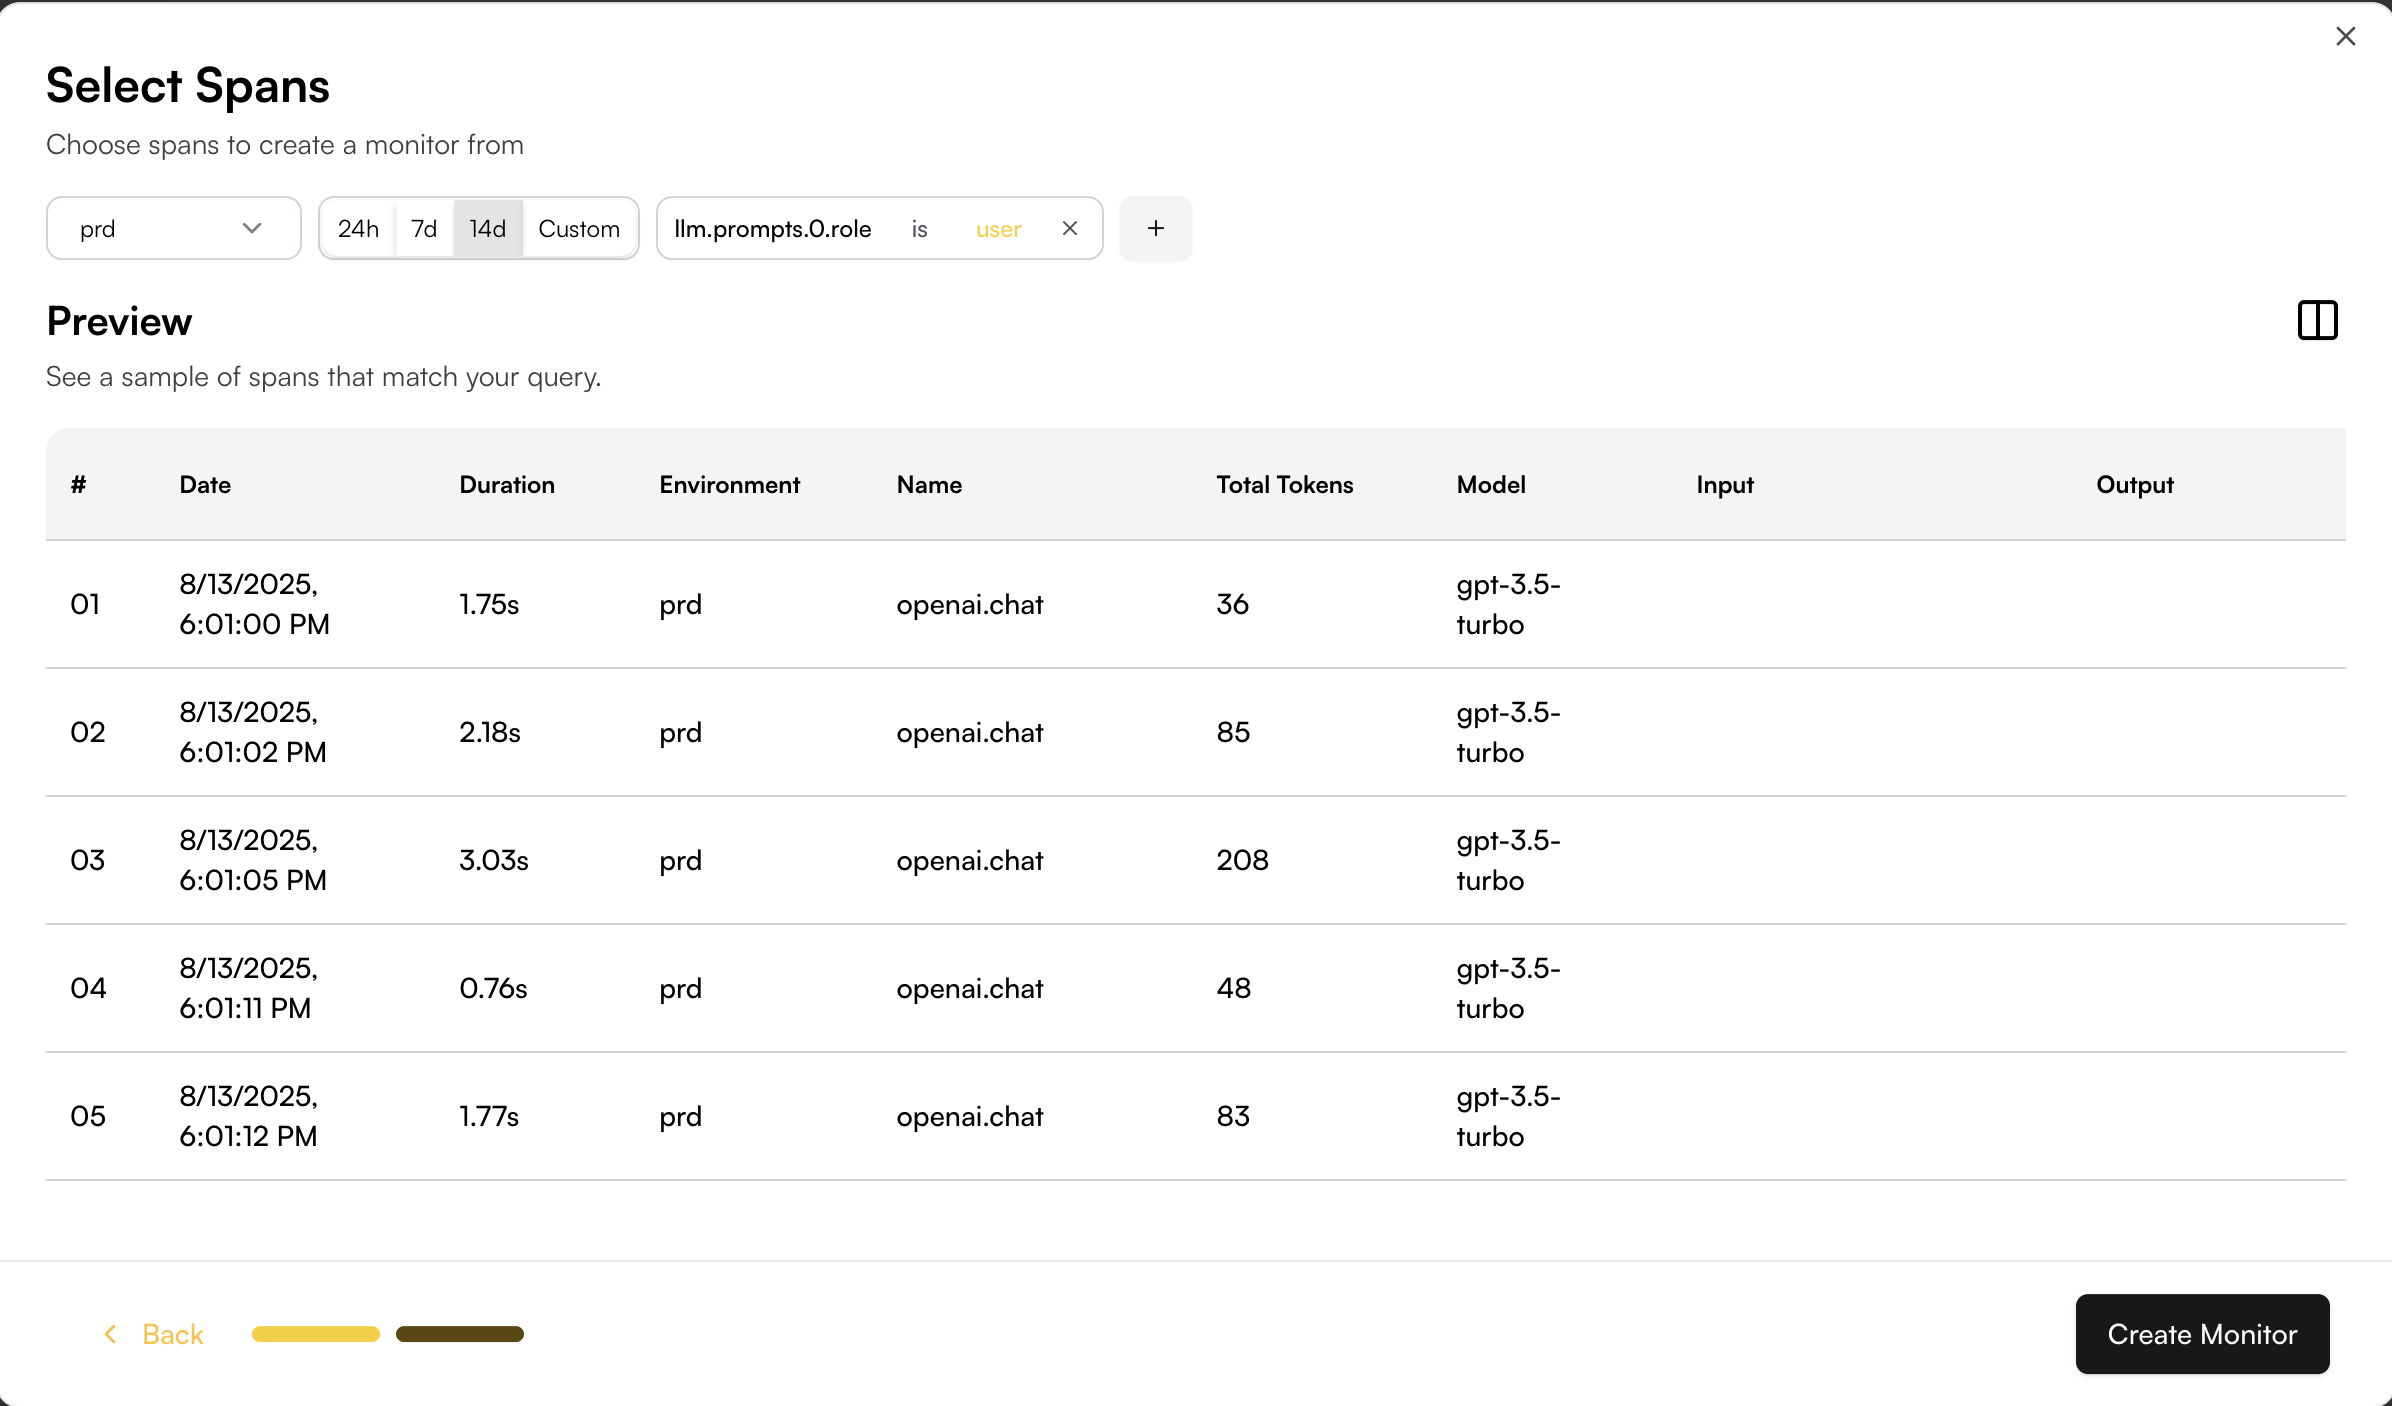
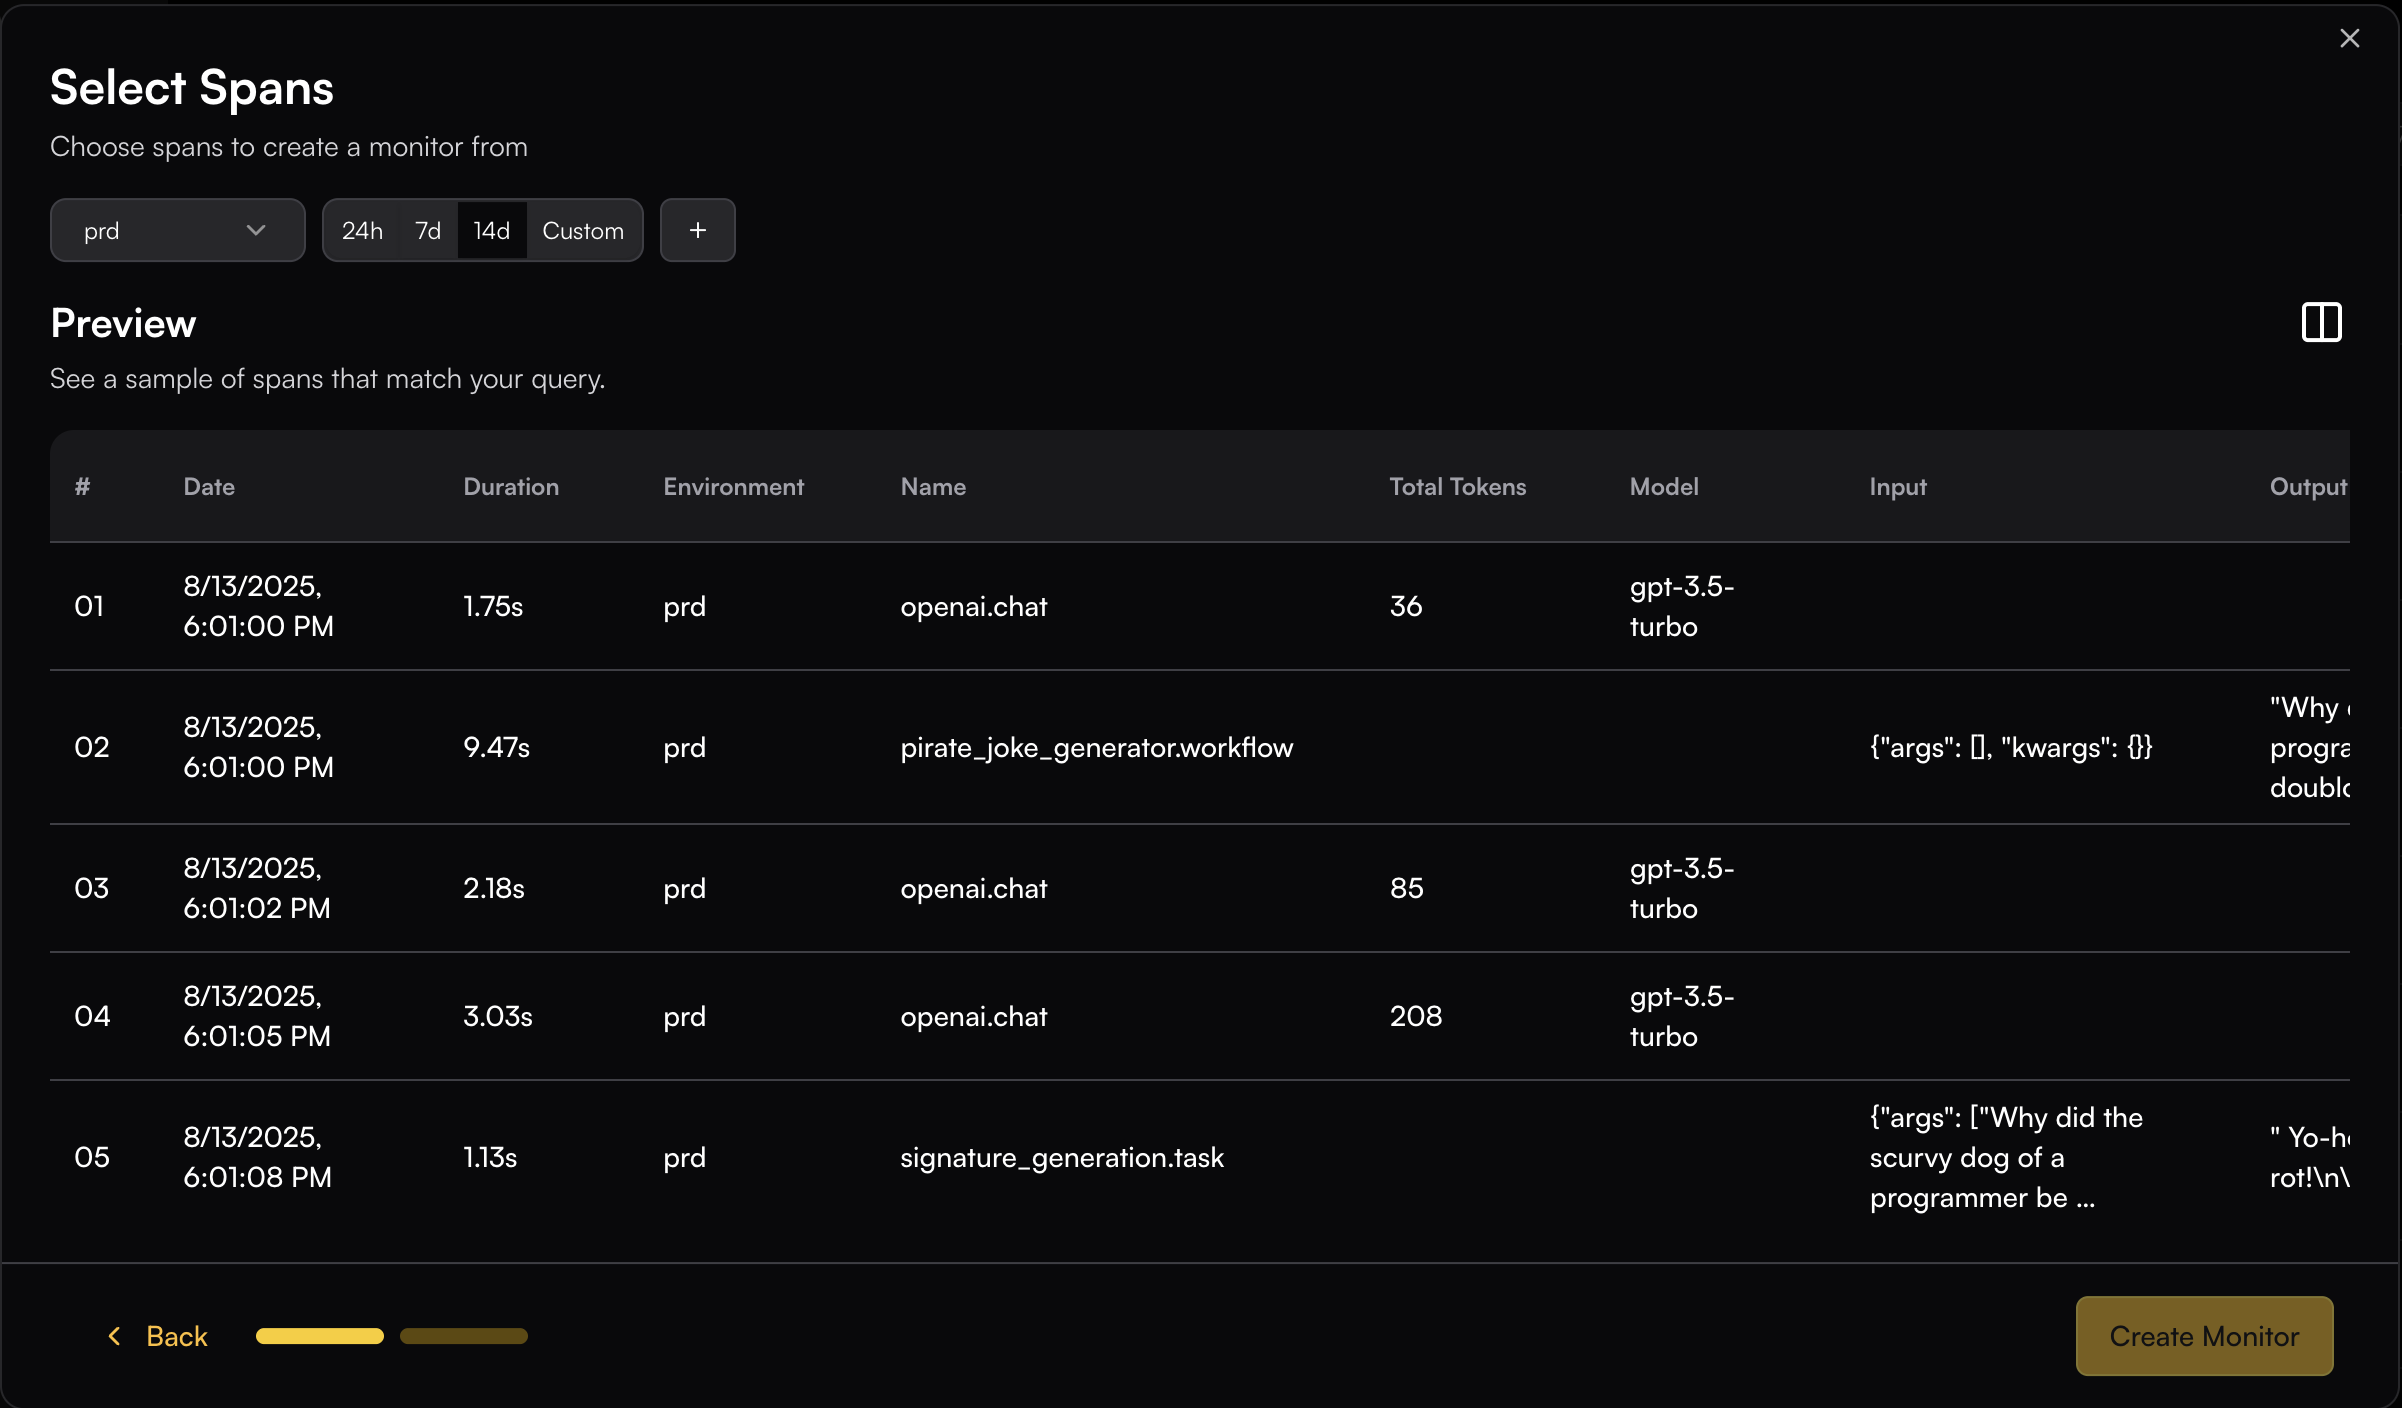
Filter Options
- Environment: Filter by a specific environment
- Workflow Name: Filter by the workflow name defined in your system
- Service Name: Target spans from specific services or applications
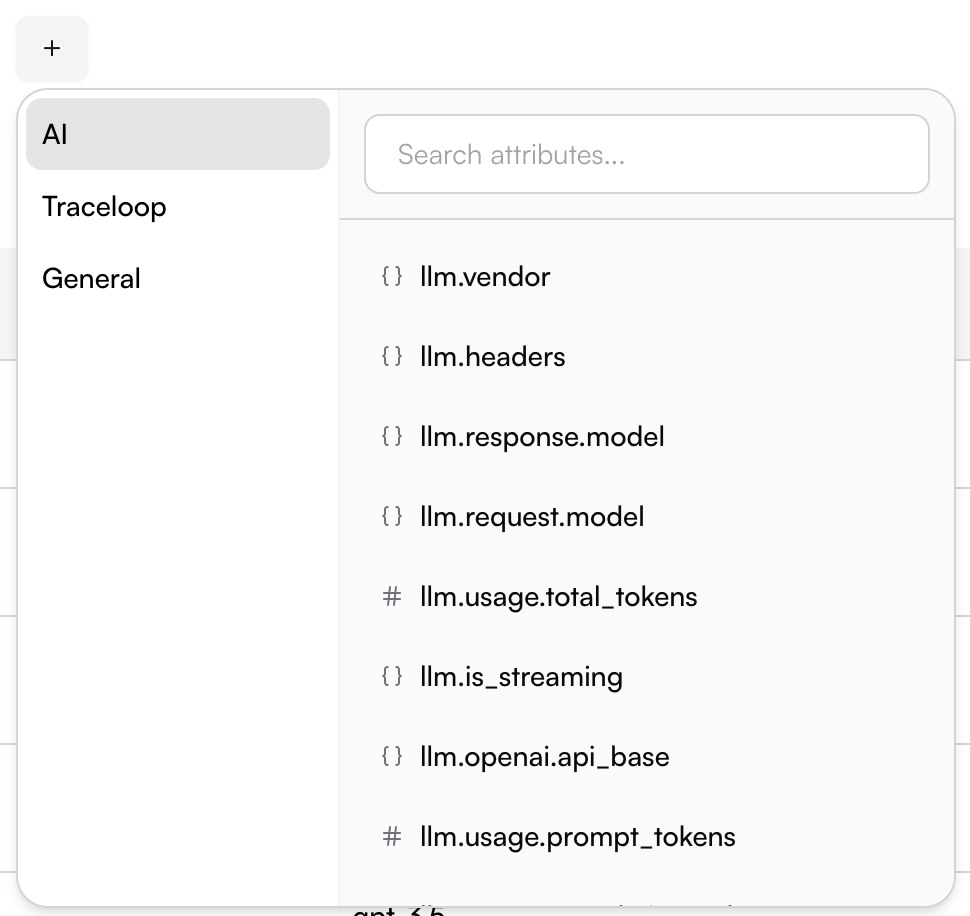
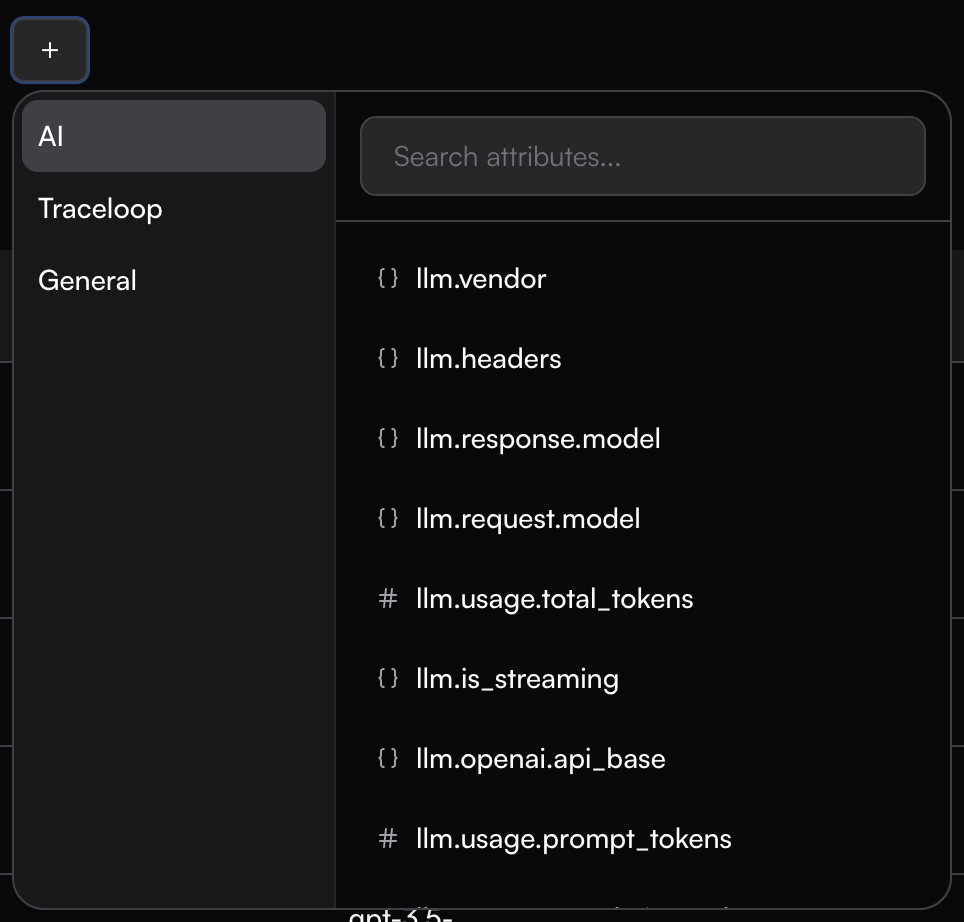
- AI Data: Filter based on LLM-specific attributes like model name, token usage, streaming status, and other AI-related metadata
- Attributes: Filter based on span attributes
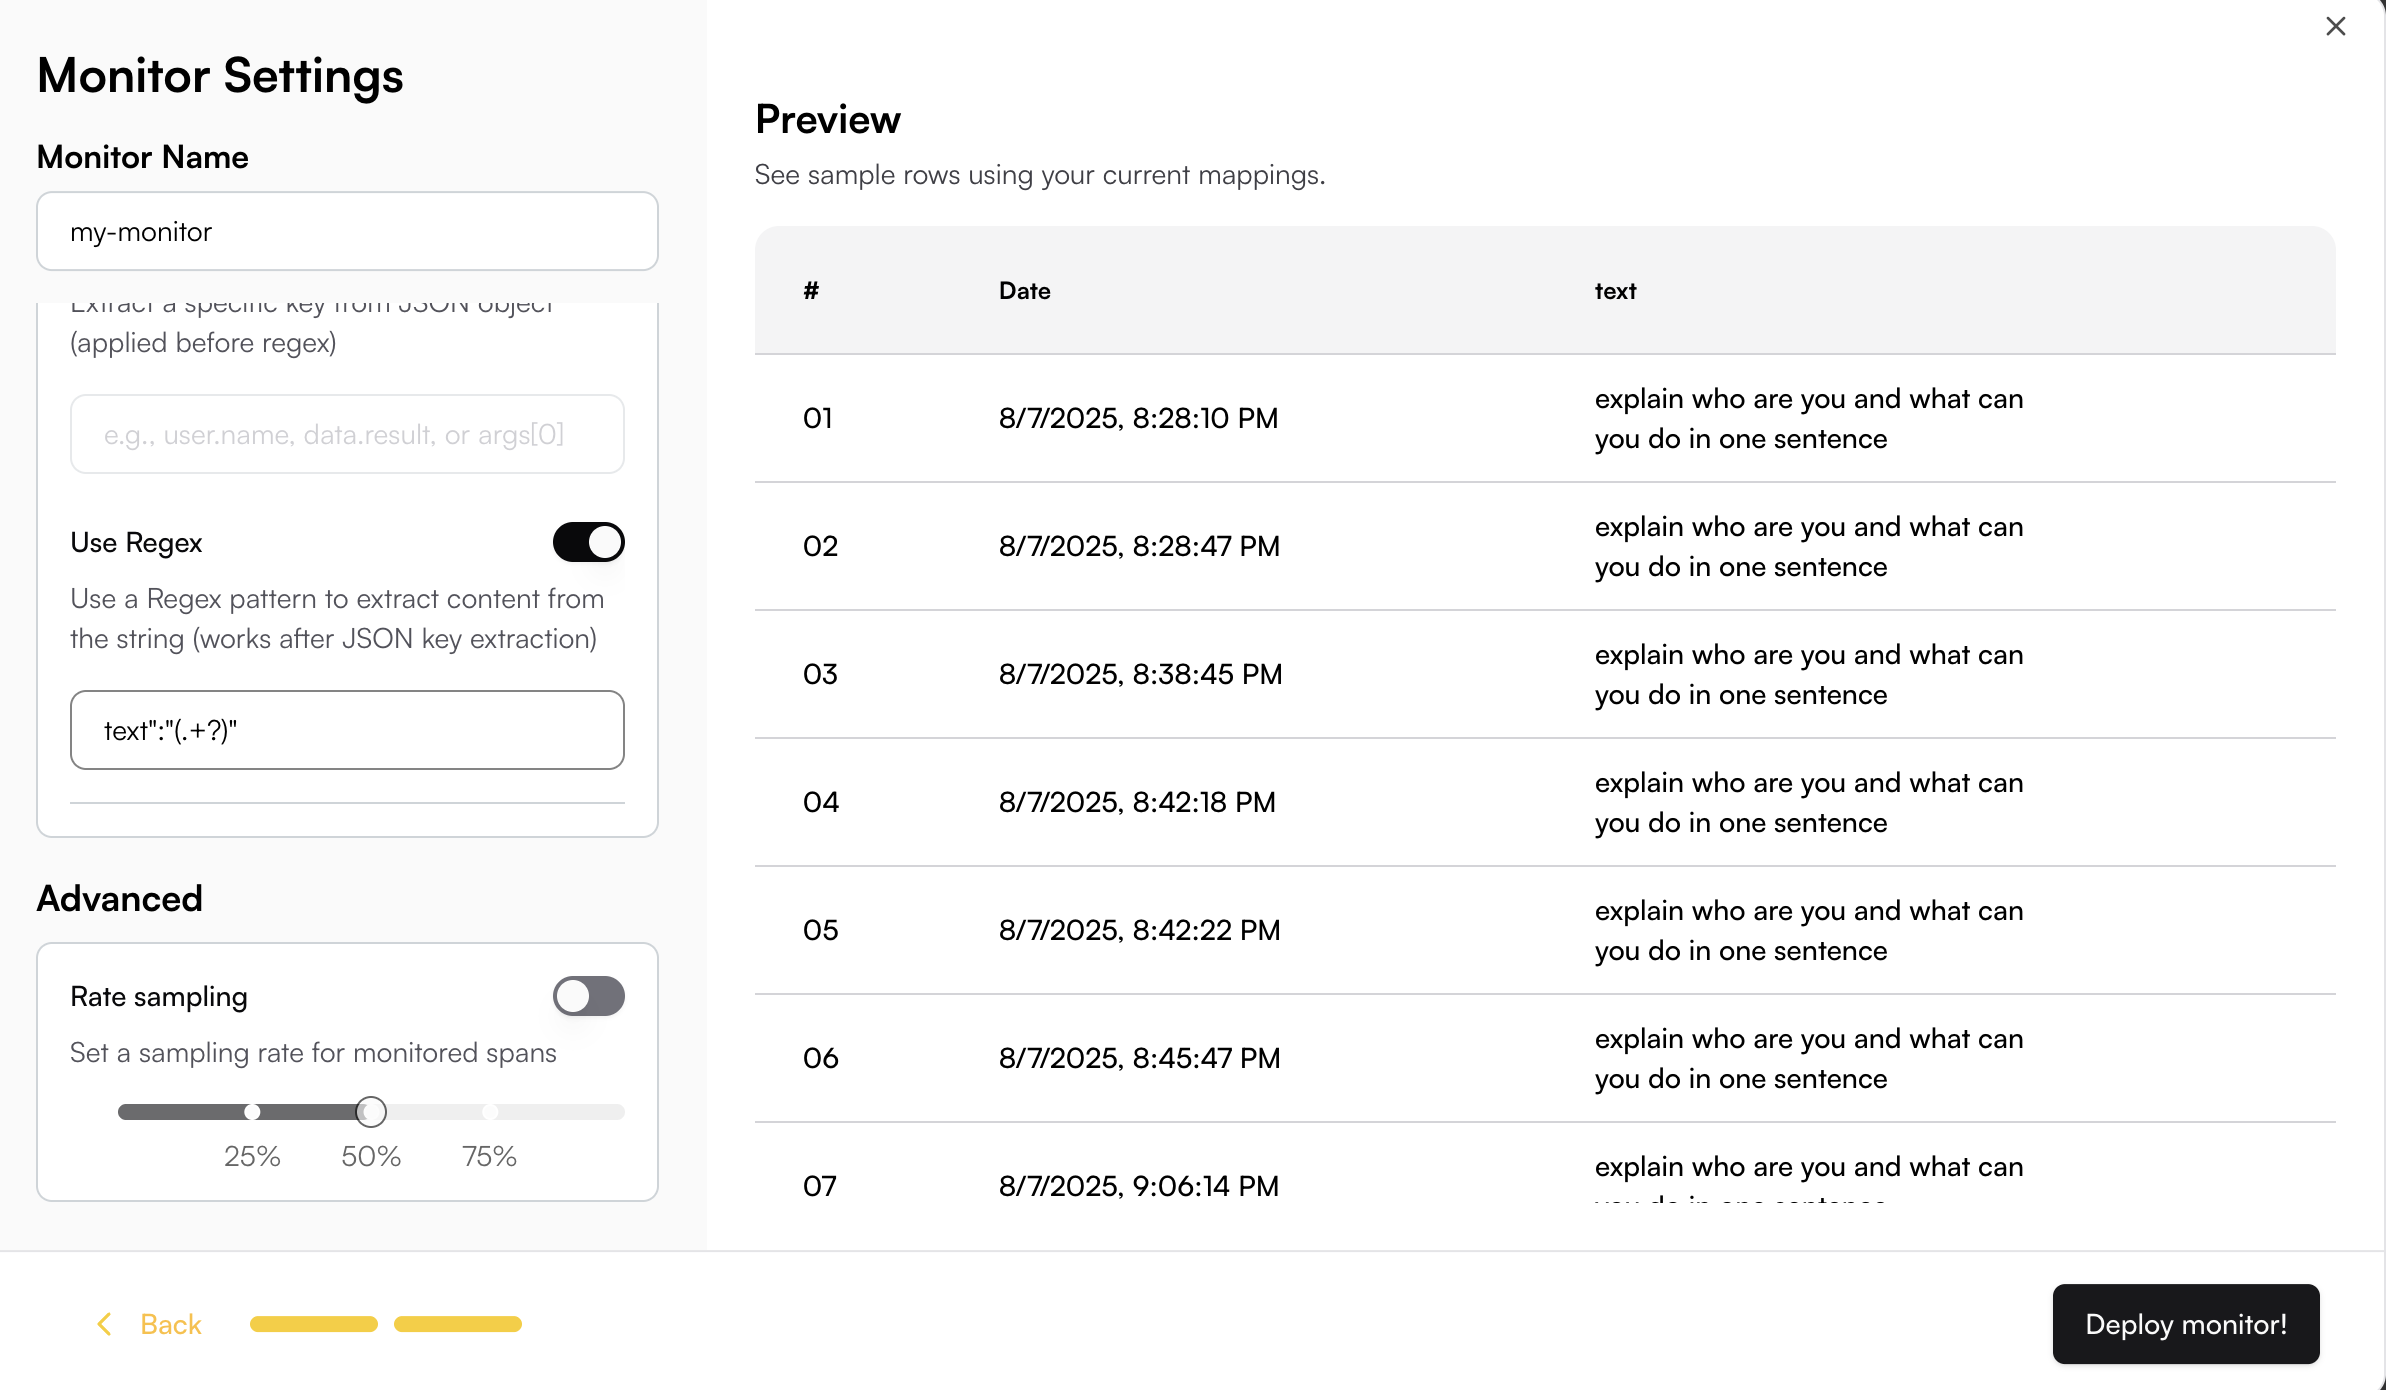
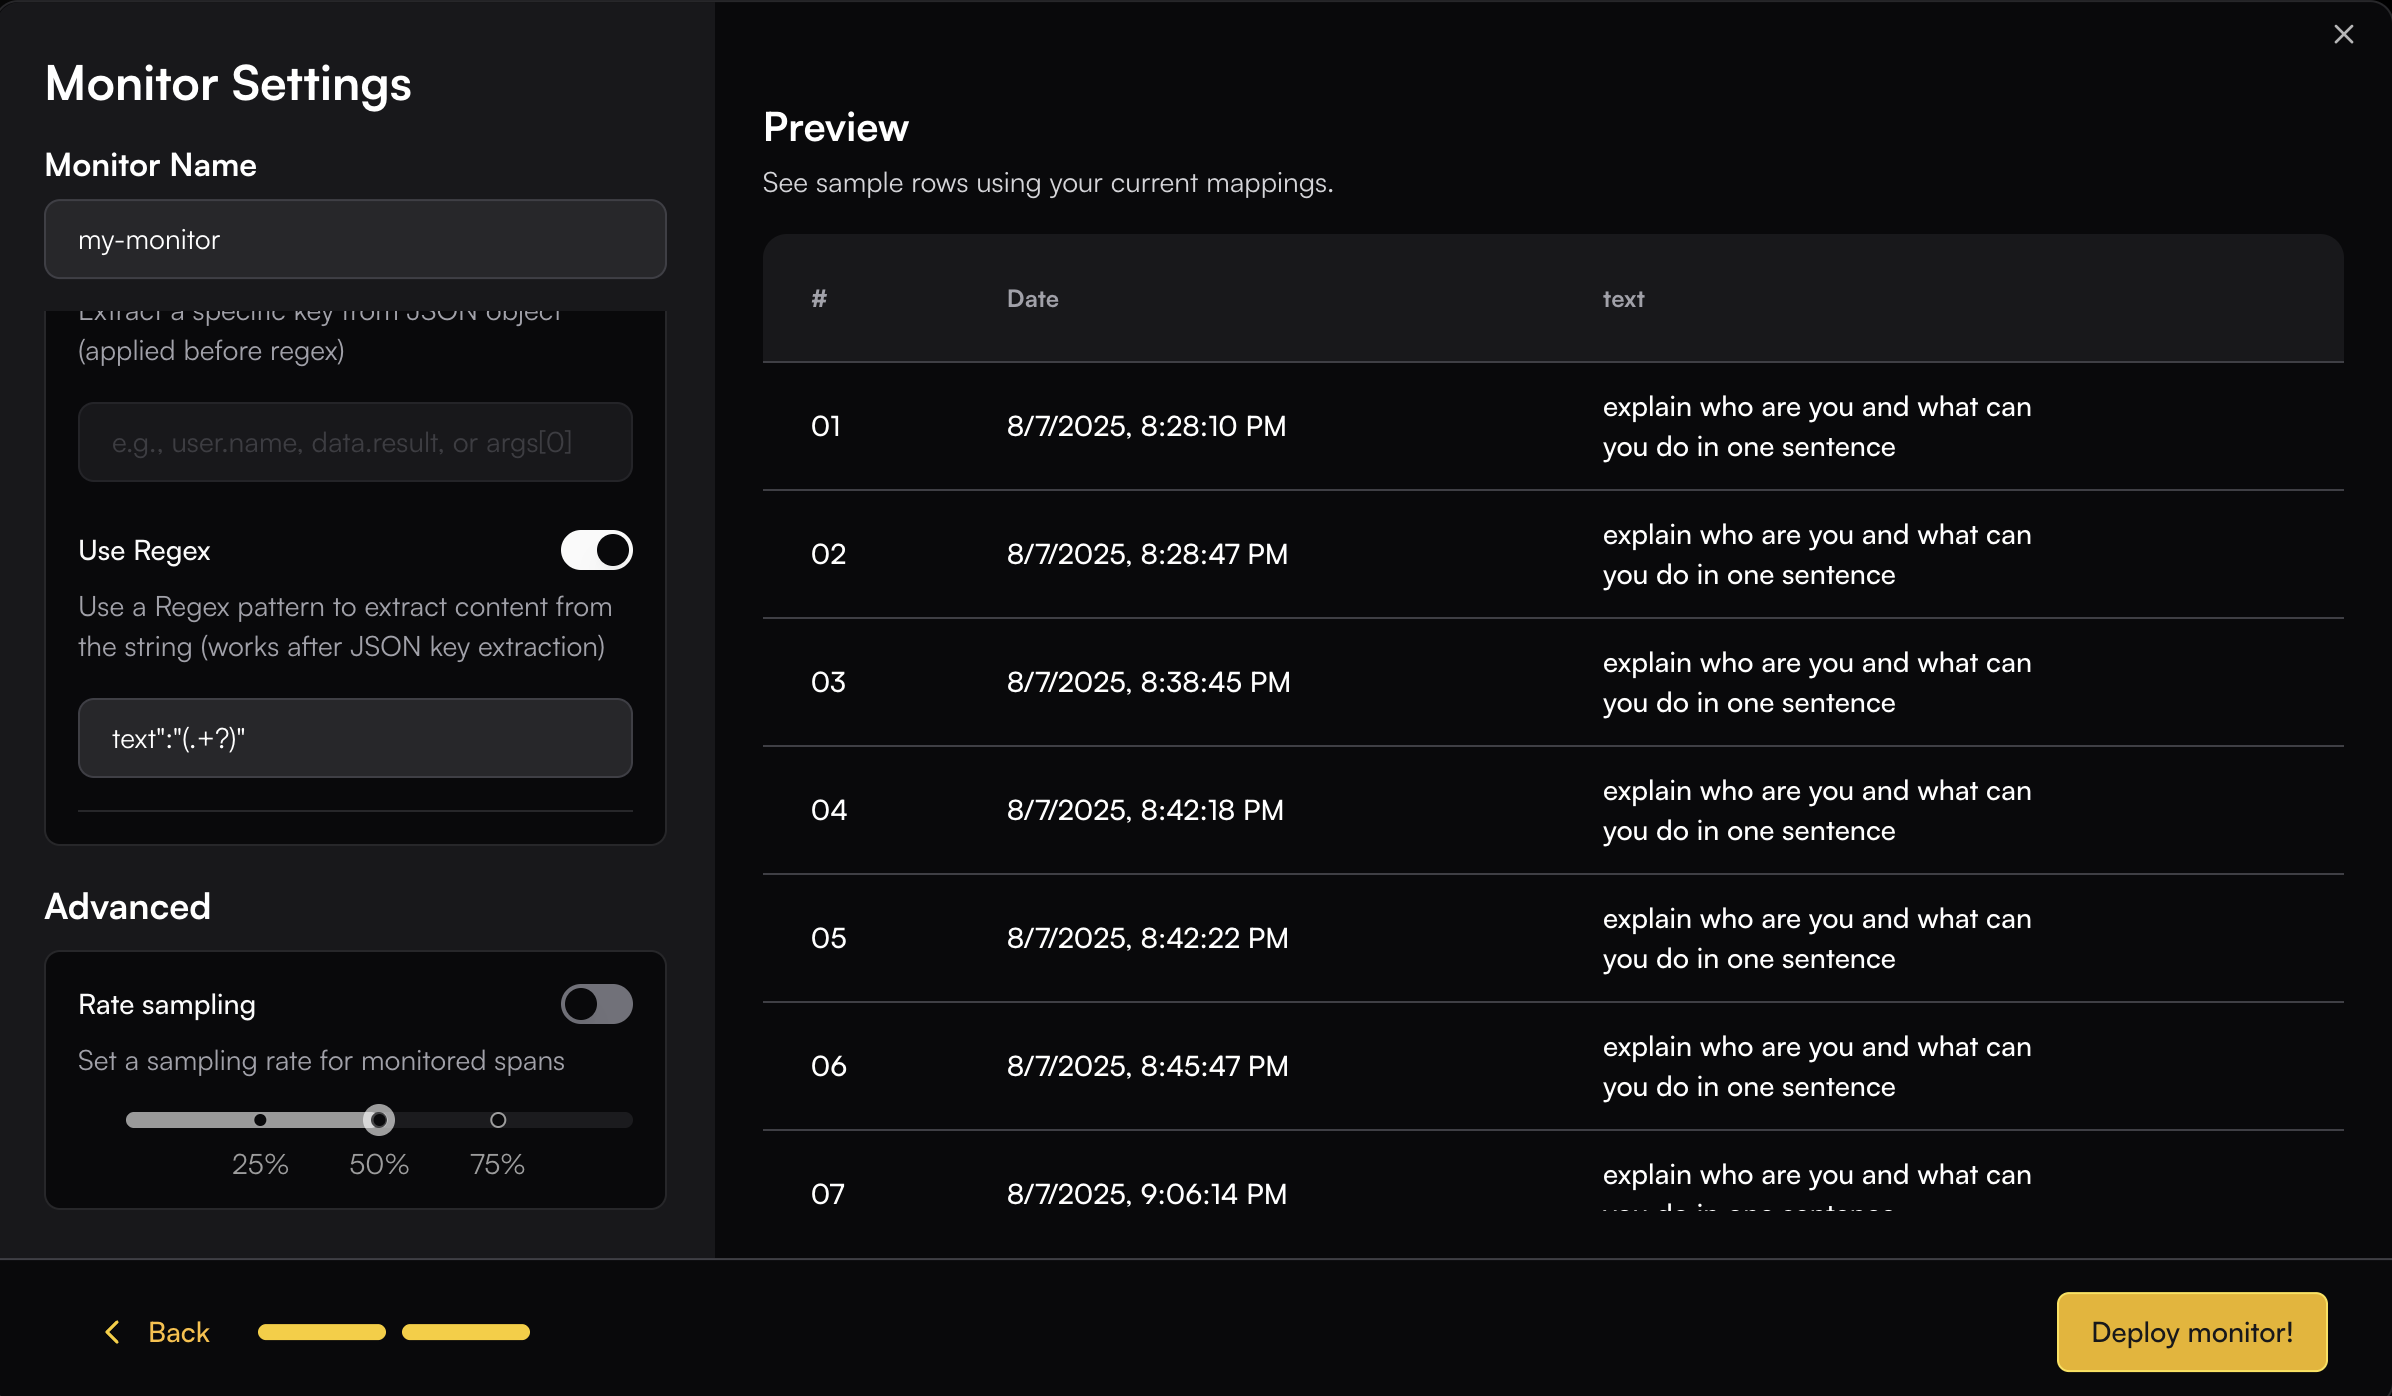
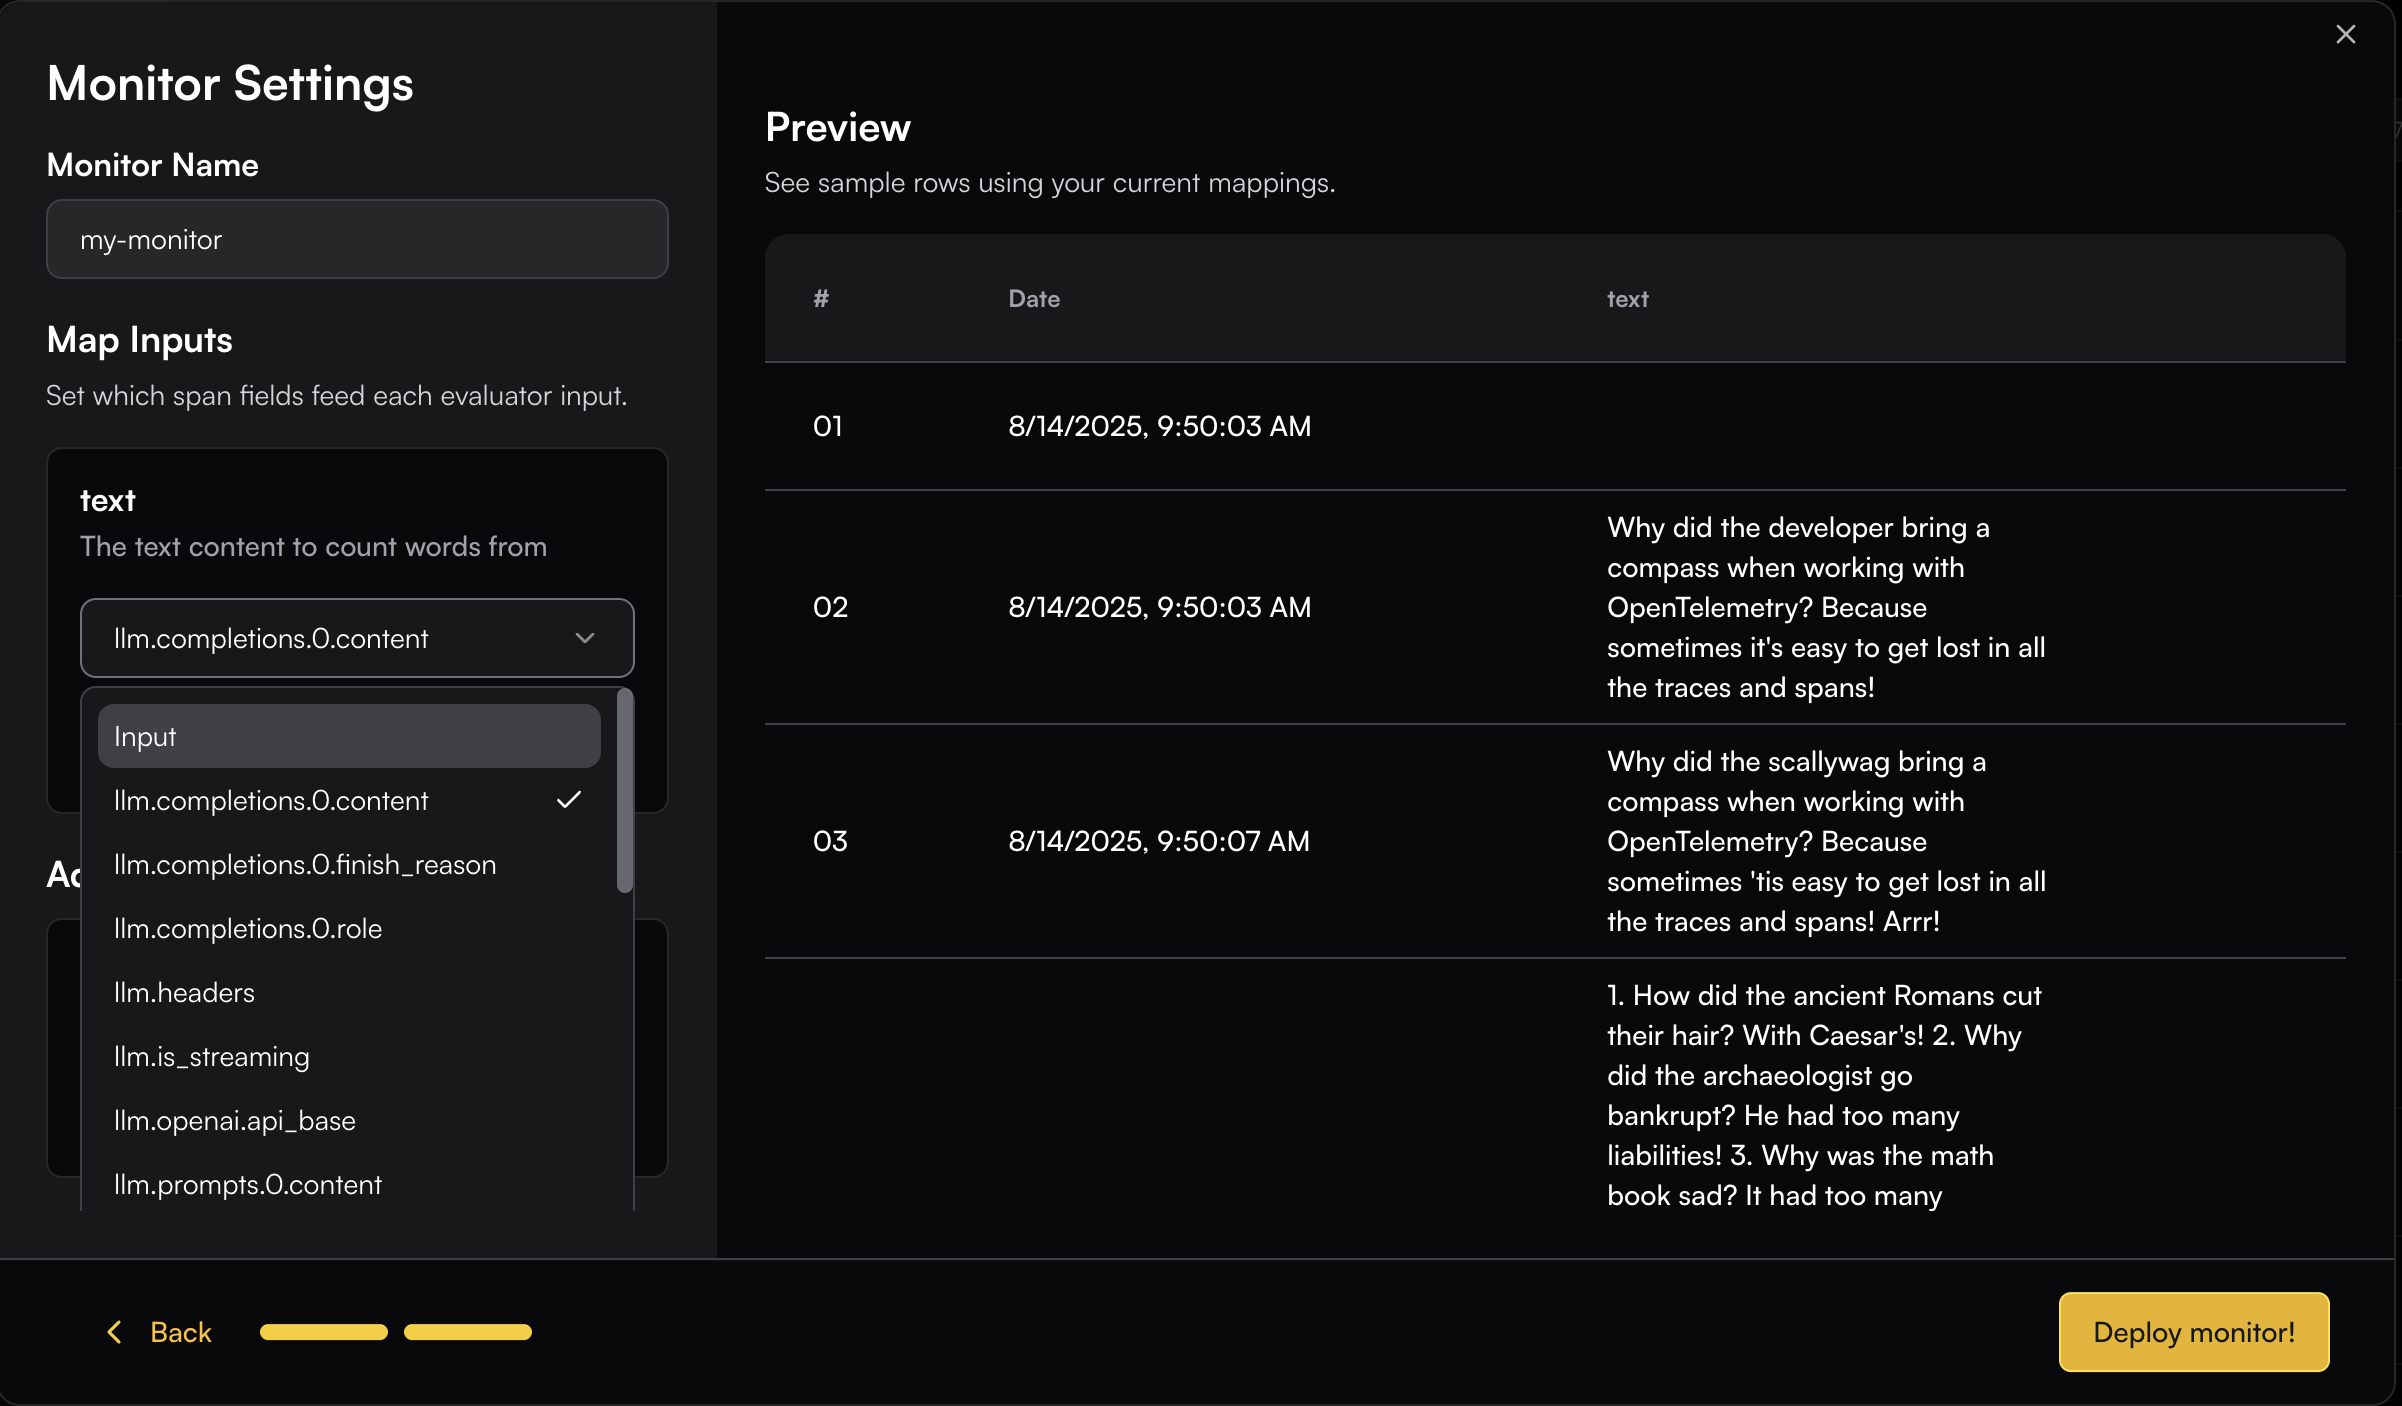
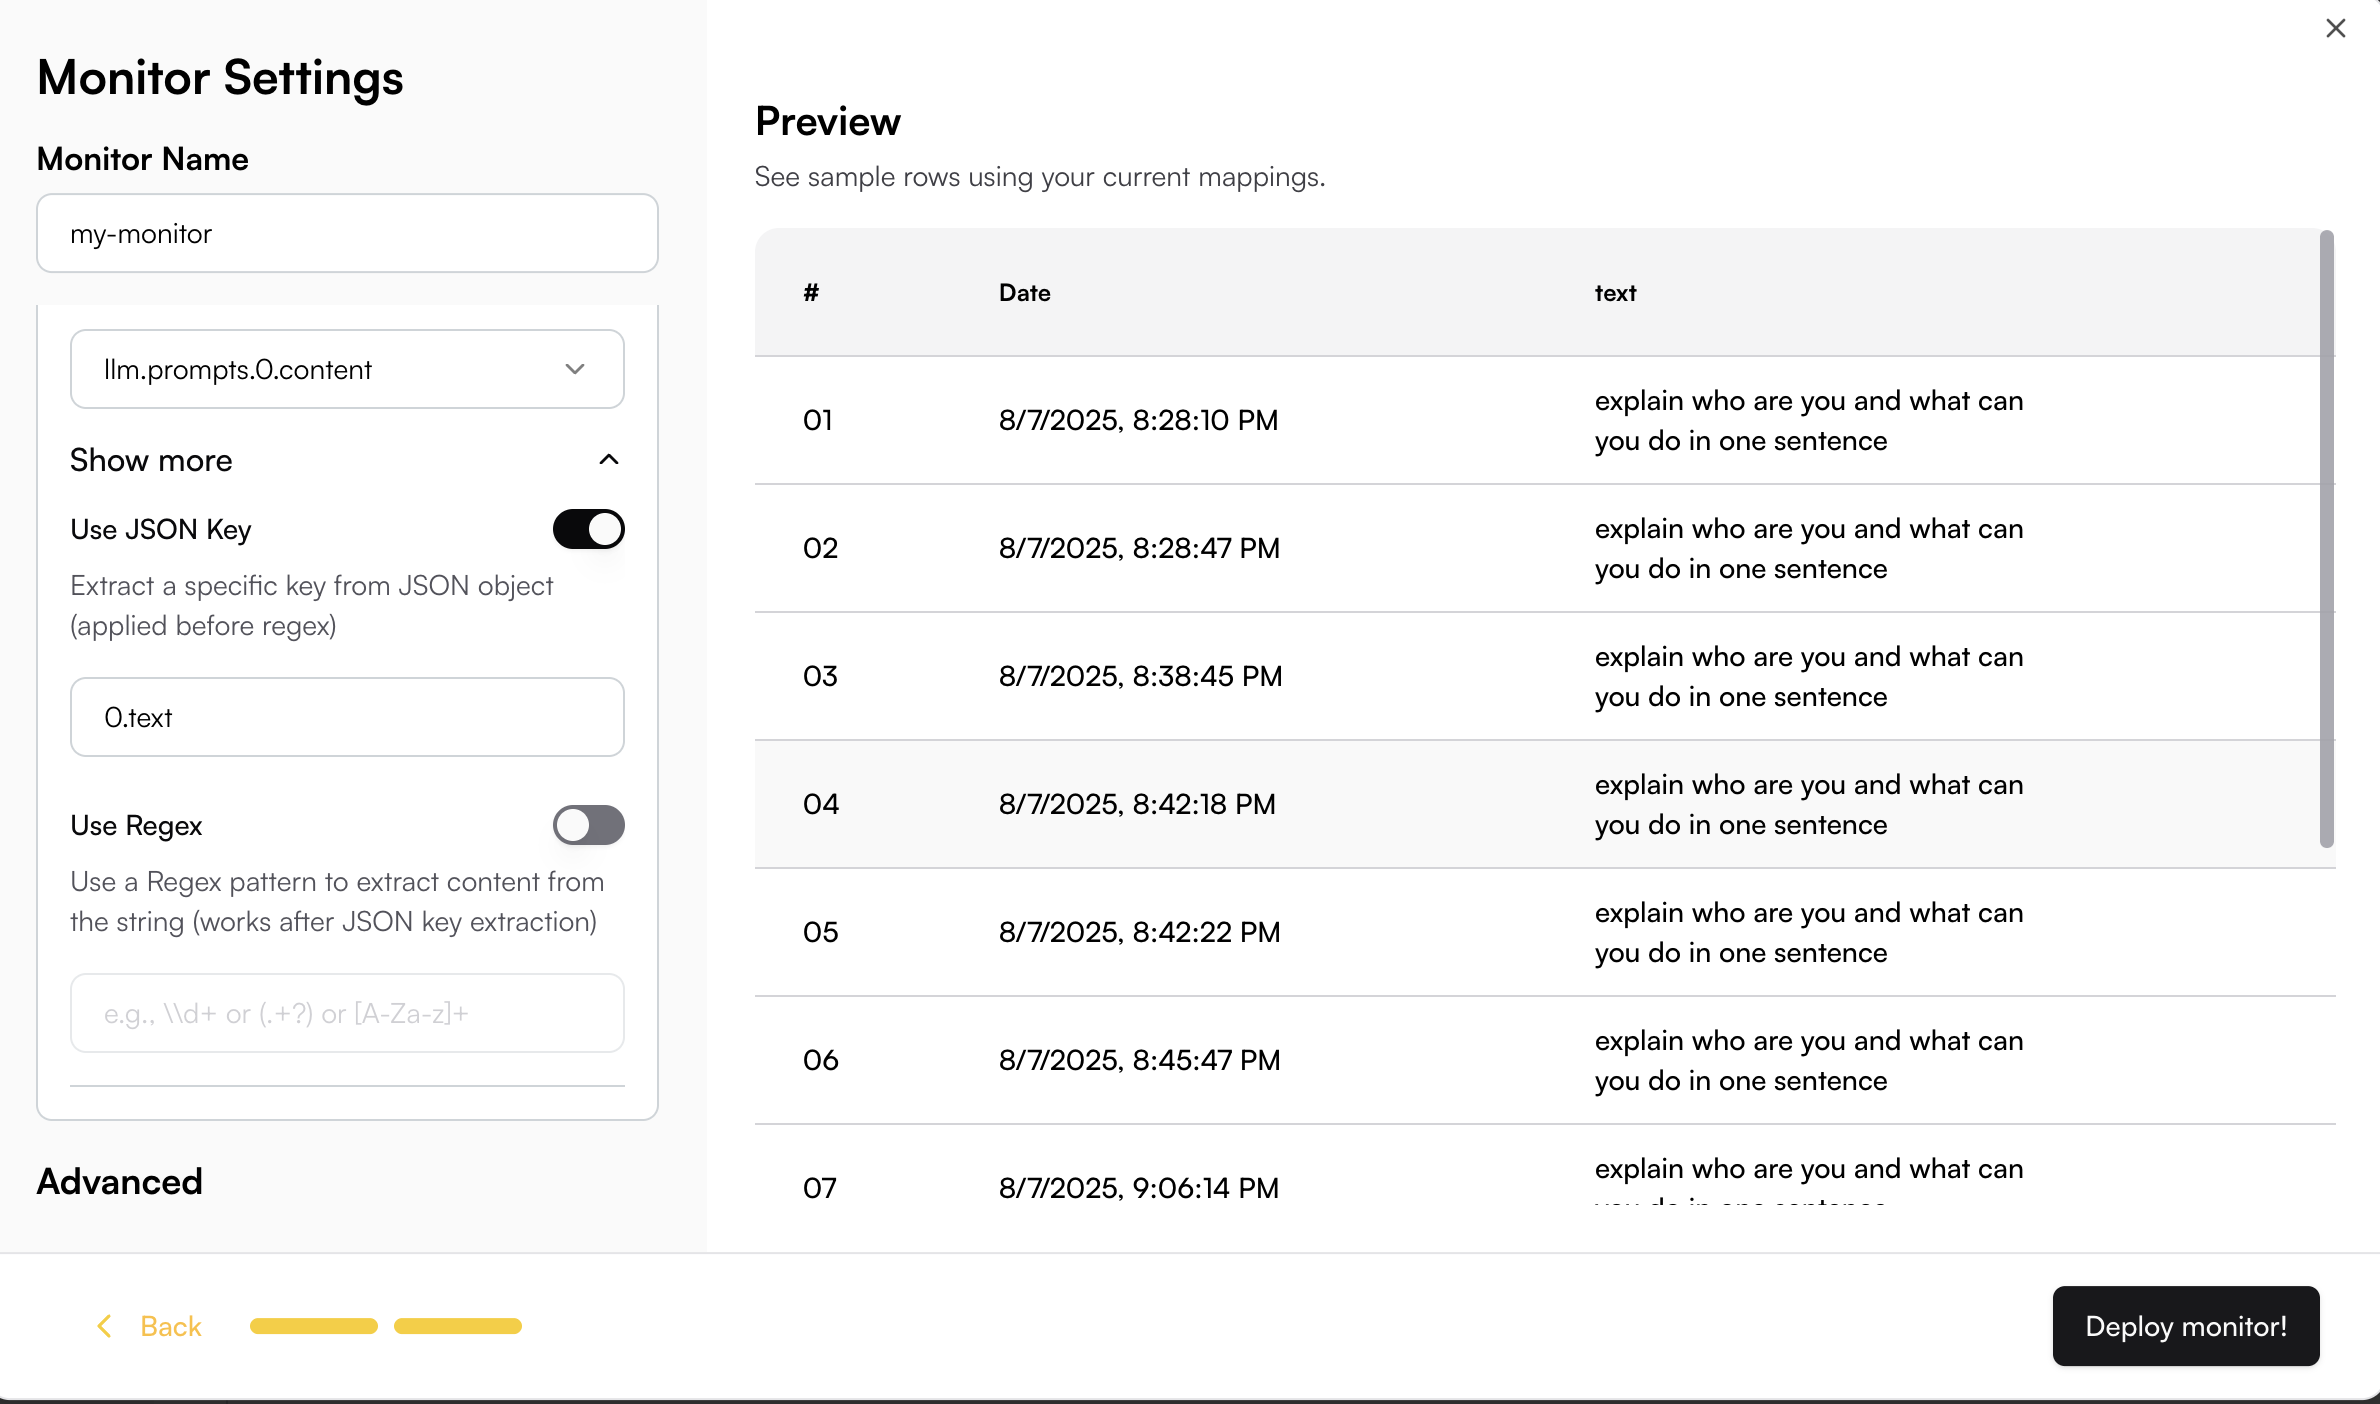
Monitor Settings
Map Input
You need to map the appropriate span fields to the evaluator’s input schema. This can be done easily by browsing through the available span field options—once you select a field, the real data is immediately displayed so you can see how it maps to the input.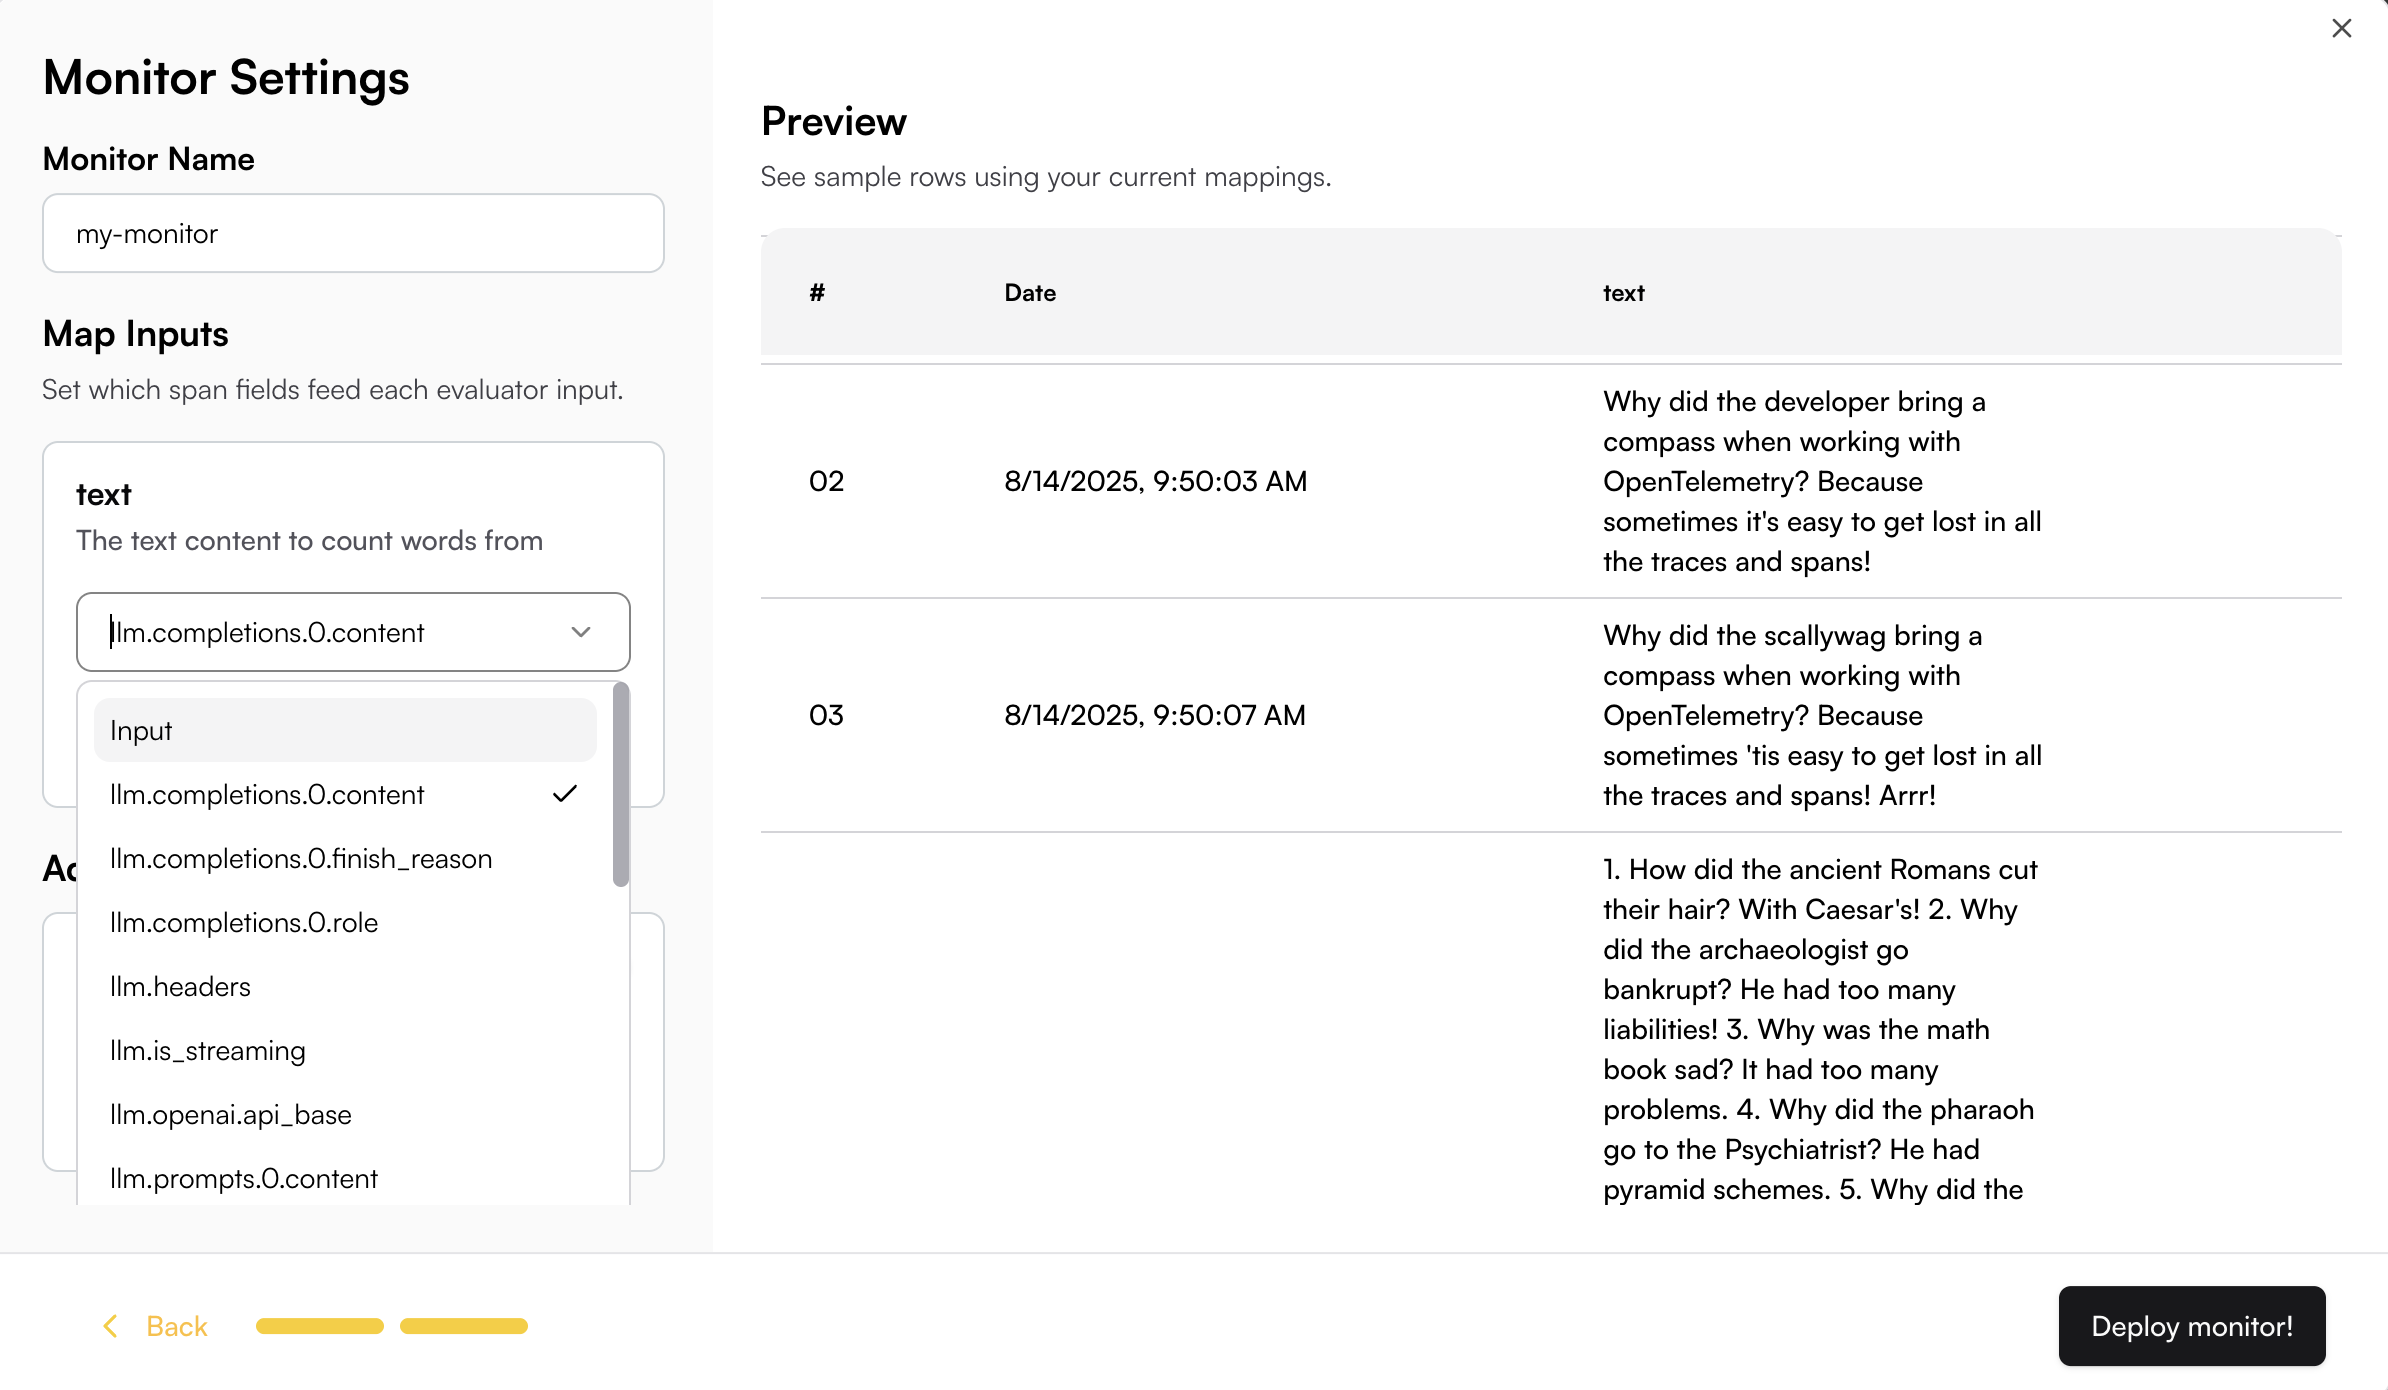
0.text to extract just the text content. The JSON key mapping will be applied to the Preview table, allowing you to see the extracted result in real-time.
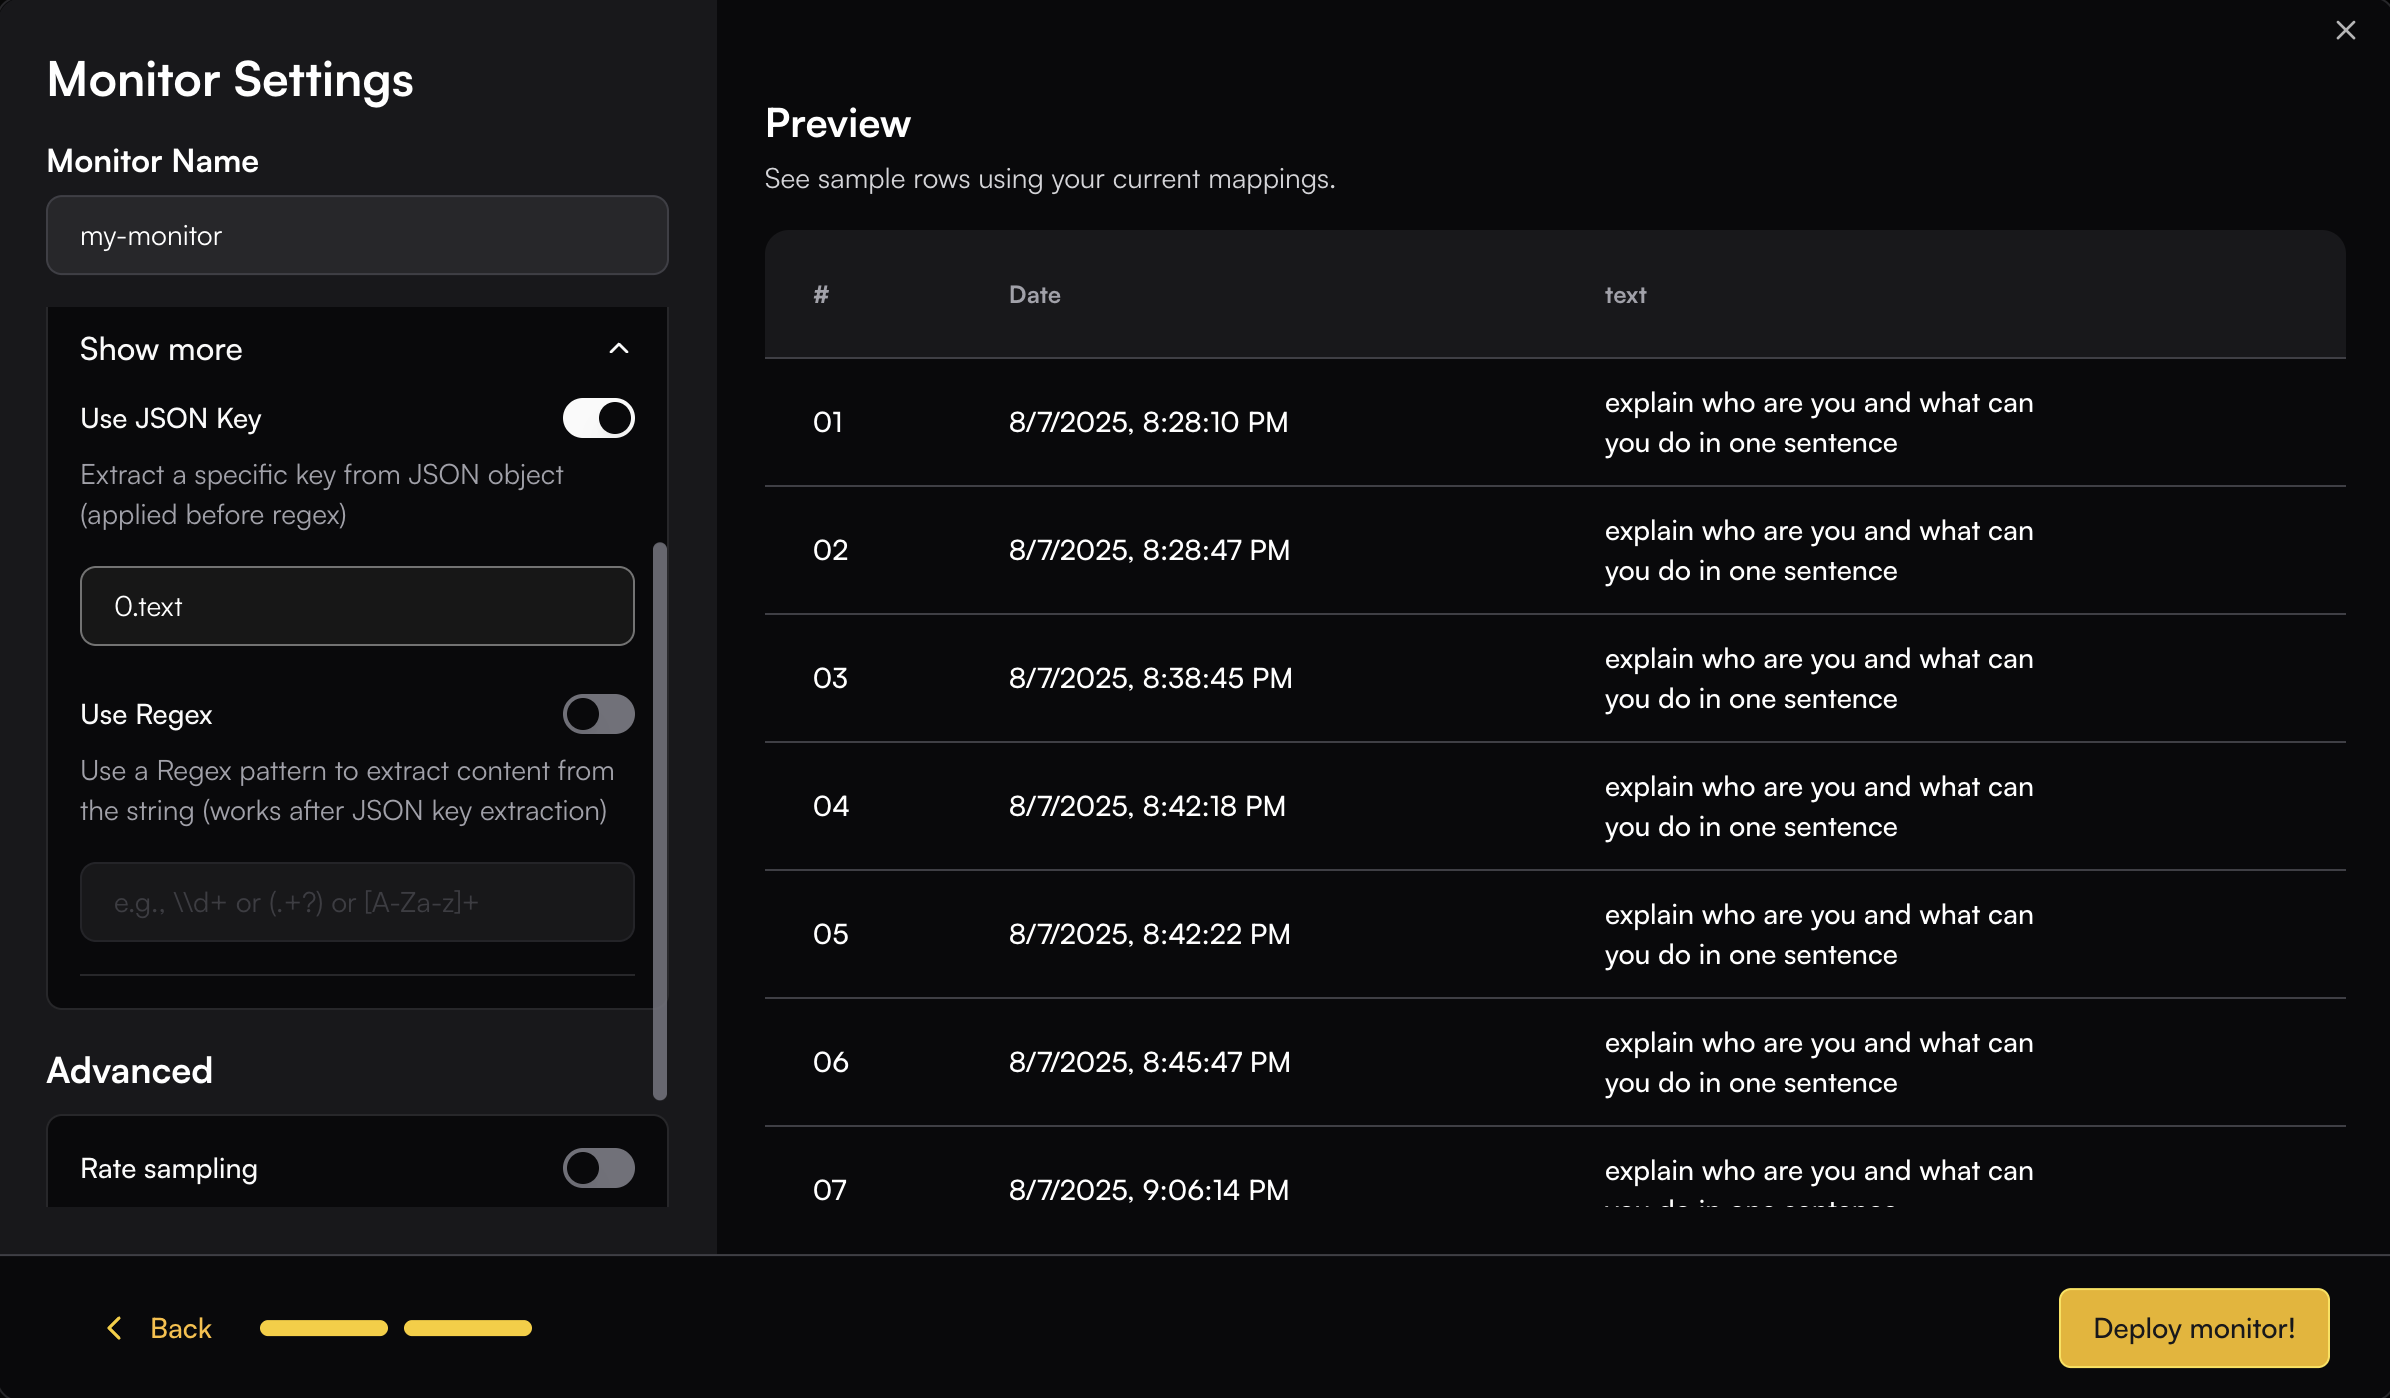
text":"(.+?)" to extract just the text content. The regex will be applied to the Preview table, allowing you to see the extracted result in real-time.